Oh, come on, cycling!

The 2018 results of two big surveys are just out: the National Travel Survey (NTS) and the Active Lives Survey (ALS), both of which record what people say they do, rather than what traffic counters log them doing.
In this blog, I’m looking at the National Travel Survey, which mainly focuses on England as a whole and on all modes of transport. The Active Lives Survey, on the other hand, is about the best place to go for data on how walking and cycling are faring at local authority level, and I’ll be considering its latest results in a separate blog.
Has the National Travel Survey made us toast active travel’s headway with something nice and bubbly, then, or sigh into our glasses?
I’m not doing a very good job of keeping you in suspense: this article’s title says everything.
Trips and mileage: the bigger picture
From 2015, the number of trips we’ve made on average a year by any mode (car, bus, bike, foot etc.) has been going up. In 2018, in fact, at just short of 1,000 per person, we saw the highest number for about a decade.
One comforting thing for the active travel – or public health – enthusiast, though, is that walking accounts for most of this. Trips on foot are up from a relatively recent low point of 219 in 2015, to 262 last year (+20%) – and, we hope, trending towards to the 271 yearly average for 2002-2006.
While it’s equally true that drivers are taking more trips by car or van, the increase isn’t nearly so marked: 381 in 2015; 395 in 2018 (+4%). Also, the average annual distance they each clock up has dropped by 12% since 2002 (3,694 miles down to 3,253).
Cycling: a smaller picture
Sadly, cycling continues to disappoint: the average number of trips per person was 17 in 2015, 15 in 2016, 17 in 2017 and 17 in 2018. This equates, as ever, to a tiny weeny 2% of all trips by private transport.
The picture for ‘stages’ (cycling for part of a longer trip) is similarly static and unimpressive for each year over the same period (18, 16, 18, 18).
Rather less unimpressive – or, it could be argued, positively impressive – is the finding that people who do cycle are putting in 61% more miles than they did in 2002 (687 miles in 2002; 1,104 in 2018, although this is a slight drop on the 1,144 in 2017).
Indeed, annual traffic estimates, based on counts rather than surveys of individual travel habits, show that miles by pedal cycle in Britain have risen by about 23% since 2002, from 2.71 to 3.33 billion.
Riding for fun/not riding at all
As I speculated last year, the boom in cycle mileage per person may be largely due to people riding further for leisure rather than commuting.
True, the average yearly distance for cycle commuting has gone up – 16 miles in 2002 and 20 last year (+25%) – but leisure mileage has more than doubled to 27 miles in 2018.
(Note: commuting and leisure are by far the most commonly reported purposes for cycling; by ‘leisure’, the Department for Transport means ‘visit friends at home and elsewhere, entertainment, sport, holiday and day trip’).
These averages, which are calculated for the whole population, look really miserable in comparison to the hundreds of miles accumulated by those who do ride, as quoted above. This is because most of the population – around two-thirds – only cycle once or twice annually or never, another figure that has hardly changed for years.
All this strongly implies that existing cyclists are riding further, most likely for fun, but the roads are by no means awash with ‘new’ riders.
Yet there’s so much potential for active travel. Many of the journeys people choose to drive are remarkably short: around a quarter of them are under two miles, and 57% under five.
Almost undoubtedly, it’s fear that’s stopping most from cycling instead. According to a separate survey of attitudes, just under two-thirds of adults agree that ‘it is too dangerous for me to cycle on the roads’ (believe it or not, this finding doesn’t change much over the years either). 'No interest in cycling', unfortunately, is another top barrier - the NTS puts it at 25%.
Same old lesson?
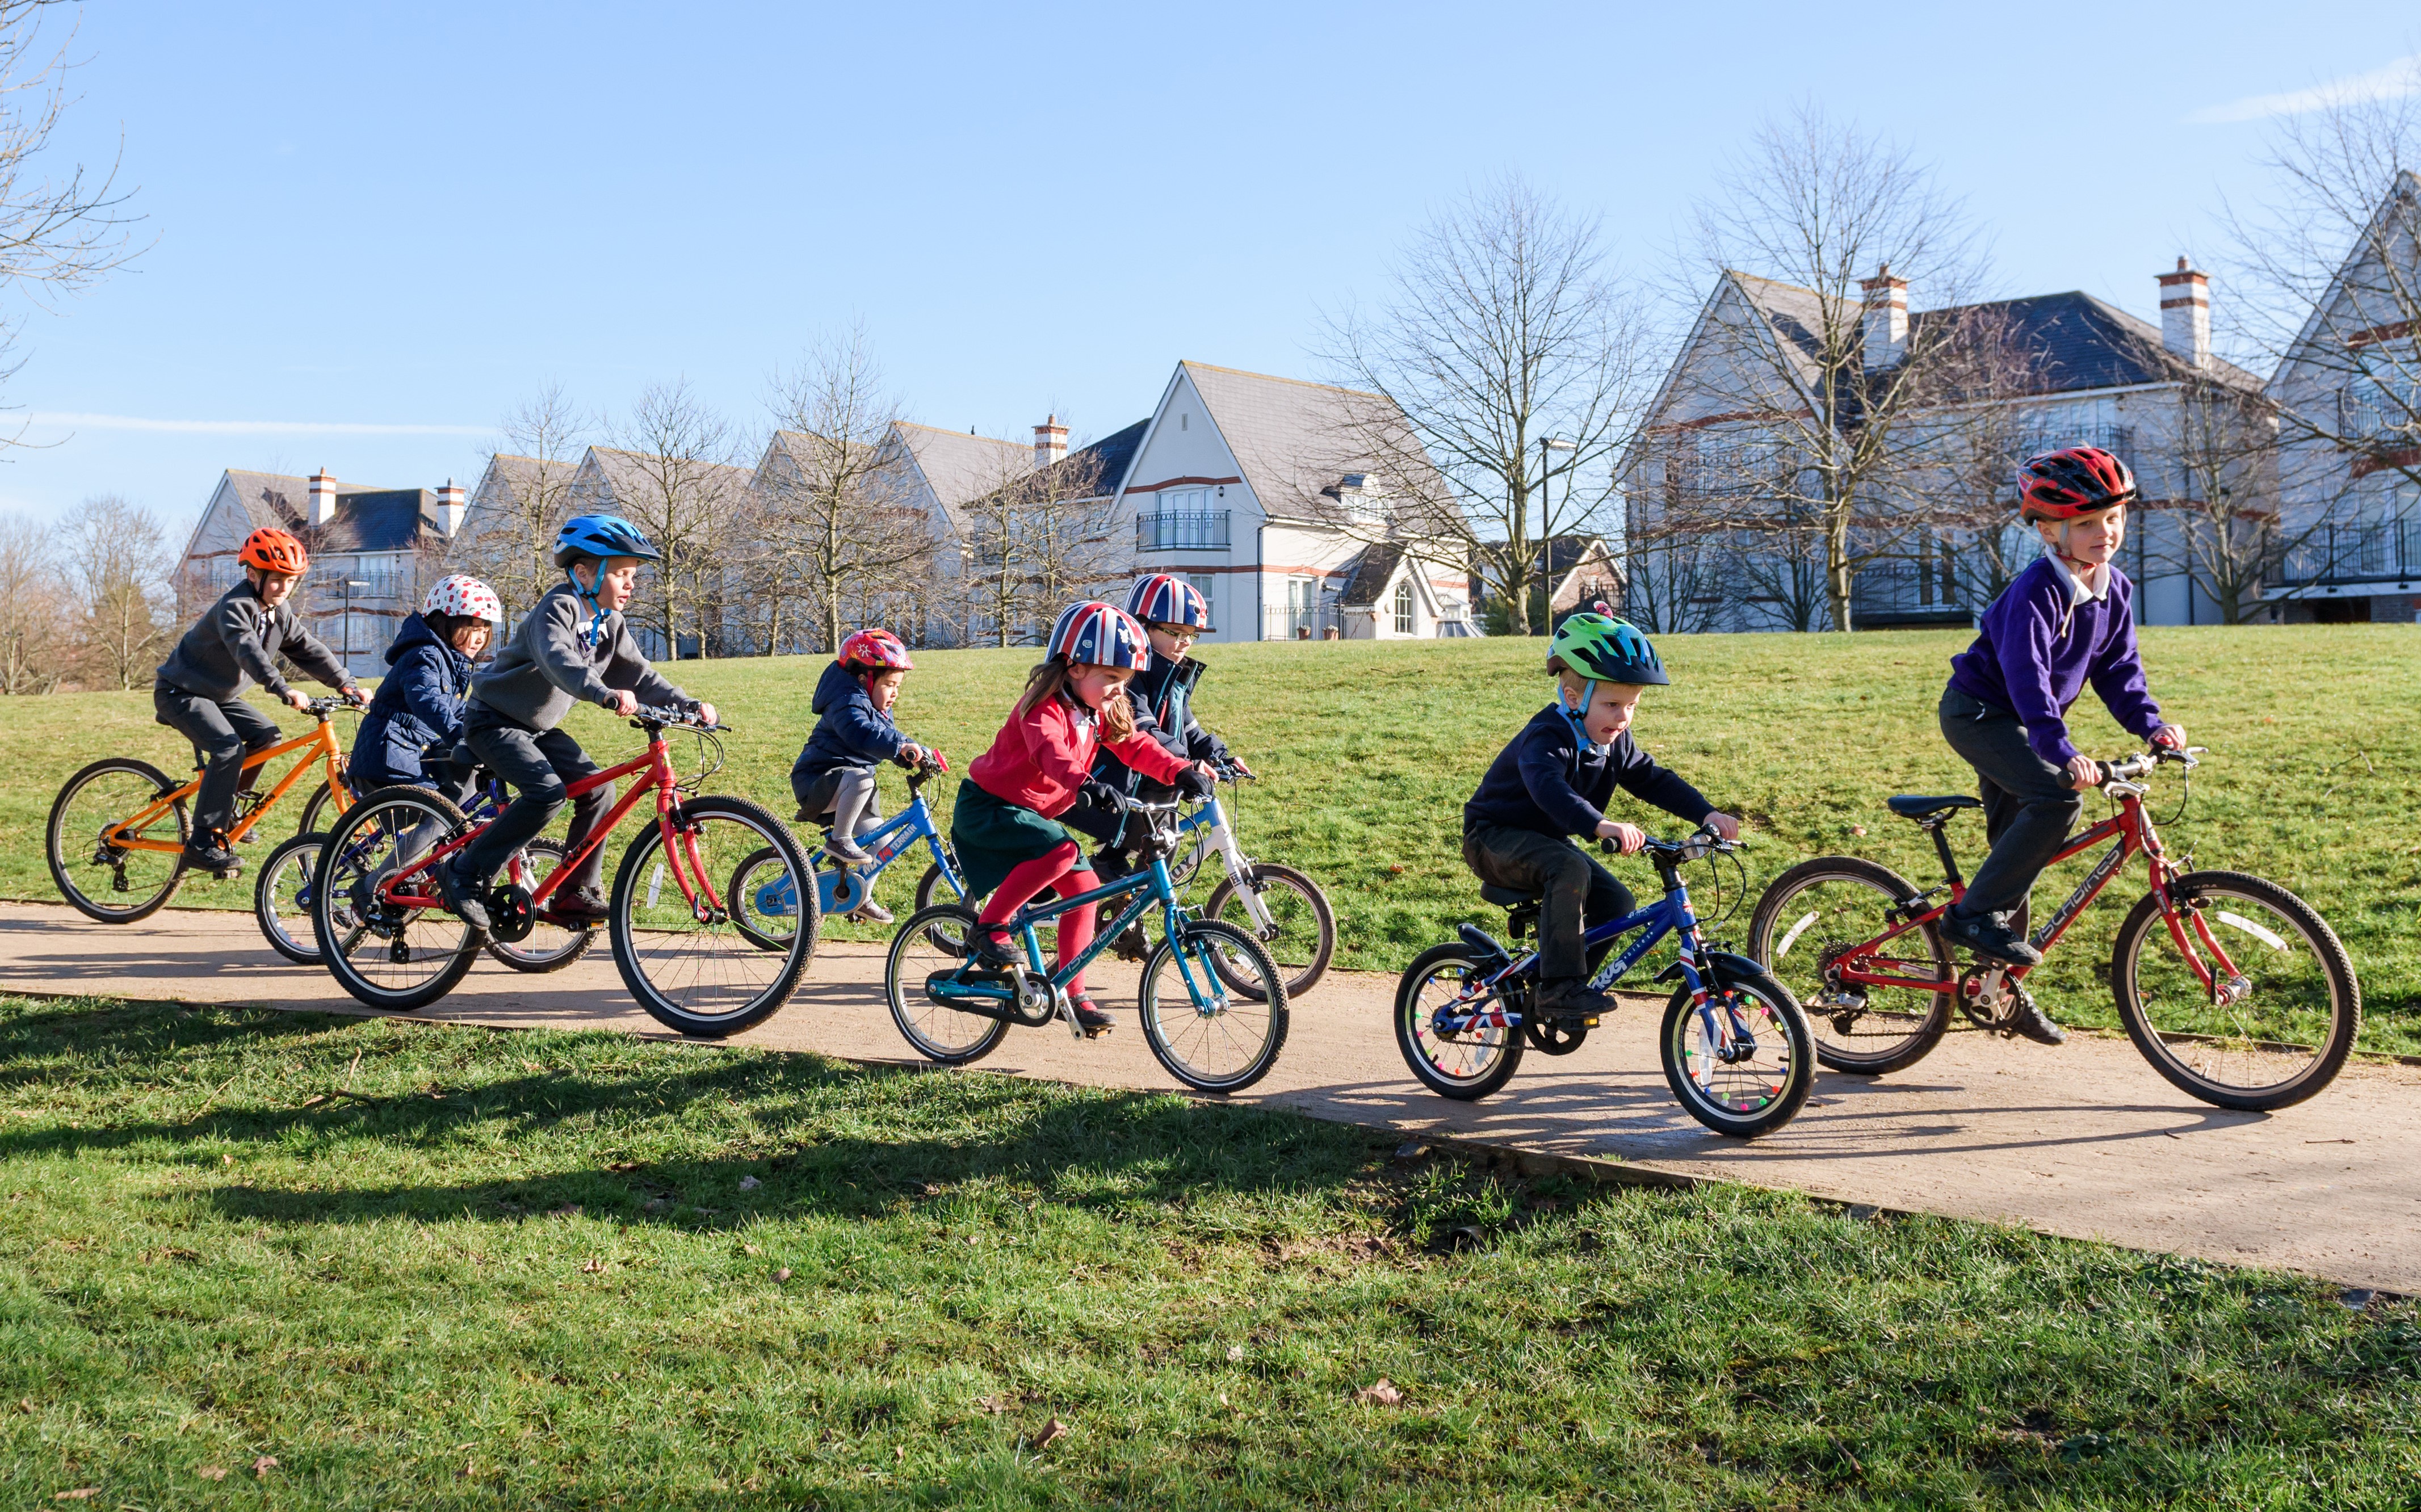
If you look at figures rounded to no decimal places, the last three years’ results for the proportion of children who usually cycle to and from school isn’t going to cheer you up:
- 2016 – 3%
- 2017 – 3%
- 2018 – 3%
But decimal places might help (a bit):
- 2016 – 2.87%
- 2017 – 2.58%
- 2018 – 3.4%
When we’re talking about proportions as small as this, however, we do need to view all year-on-year fluctuations with sober caution.
A quiet hurray for 2018 here, though, from me: the NTS figures on school travel span 23 years and this is the first time over this period that they've leapt over 3% mark (1995/97 stood at a pitiful 1.32%).
Same old gender balance?
Virtually.
Cycle trips per male (all ages):
- 2015 – 25
- 2016 – 22
- 2017 – 24
- 2018 – 25
Trips per female (all ages):
- 2015 – 9
- 2016 – 7
- 2017 – 9
- 2018 – 10
In other words, males still tend to cycle 2.5 to 3 times more than females. It is thus no surprise to find that women are more likely than men to agree that it's too dangerous to cycle on the roads (68% compared to 54%).
Just same old
While I was writing my blog last summer on the NTS for 2017, I gazed out of the window wondering whether people out there were cycling about in larger – or, should I say, less miniscule – hoards, and if this year’s blog would have me saying the same thing.
Well, they weren’t, so I am.
What’s going to help? How is the Government going to meet its 2025 target to double the estimated number of stages that people in England cycled collectively in 2013?
By doubling the investment in it at the very least, we say, so please get stuck into our ongoing funding campaign and take action now by writing to the new transport minister about it (it'll only take you a couple of minutes).
Here’s to having something to celebrate in 2020.
- National Travel Survey 2018, DfT, published 31 July 2018.


